Every contractor knows their revenue.Almost none know their margin.
The moment an invoice is paid, Lead Dog sets it against the costs already tracked on that job. So you stop running the business on what came in, and start running it on what you actually kept.
The gold ring is everything you billed. The green is what stayed.
Scroll it. The story writes itself.
A line on a chart is just a line until you can see what you did that made it move. Keep scrolling.
Some of your jobs are losing money. Would you know which?
Lead Dog records the margin on every finished job. Below is an illustration of what that data holds — each dot a job, billed value across the bottom, margin up the side. Most contractors have never seen their work laid out this way, and the first look is usually uncomfortable.
This chart is an illustration to show what job-level margin data reveals. In Lead Dog the same numbers appear in your reports and dashboards — the per-job margin is what matters, not the shape of the graph.
$48,200 came in.
Here's what stayed.
Built from costs already tracked on each job — labour hours from timesheets, materials from the estimate, fuel from the route. Nothing reconstructed at year end.
Your busiest crew isn't your best crew.
- C2Crew 2 — Sam & Rosa58 jobs · $214 average$12,410revenue38%margin
- C1Crew 1 — Dave & Marcus71 jobs · $168 average$11,930revenue27%margin
- C3Crew 3 — Tomás & Will49 jobs · $185 average$9,070revenue31%margin
- C4Crew 4 — new team36 jobs · $151 average$5,440revenue19%margin
Ranked by revenue, Crew 1 leads. Switch to margin and the order changes.
Numbers are only useful if they change something
Here's what contractors actually do the week after they see all this for the first time.
Reprice the work that's underwater
You don't need to raise every price. You need to find the two service types quietly running at 8% and fix those — which you can only do once you can see them separately.
A few points of margin, on every jobPut your best crew on the right work
When you can see who returns the strongest margin, job assignment stops being about who's free and starts being about who makes that kind of work pay.
Same crews, better allocationStop bidding the jobs that never pay
Every contractor has a category of work they take on out of habit that has never made money. Turning those down is the fastest margin improvement available to you.
Fewer jobs, more profitFilter it however the question arrives.
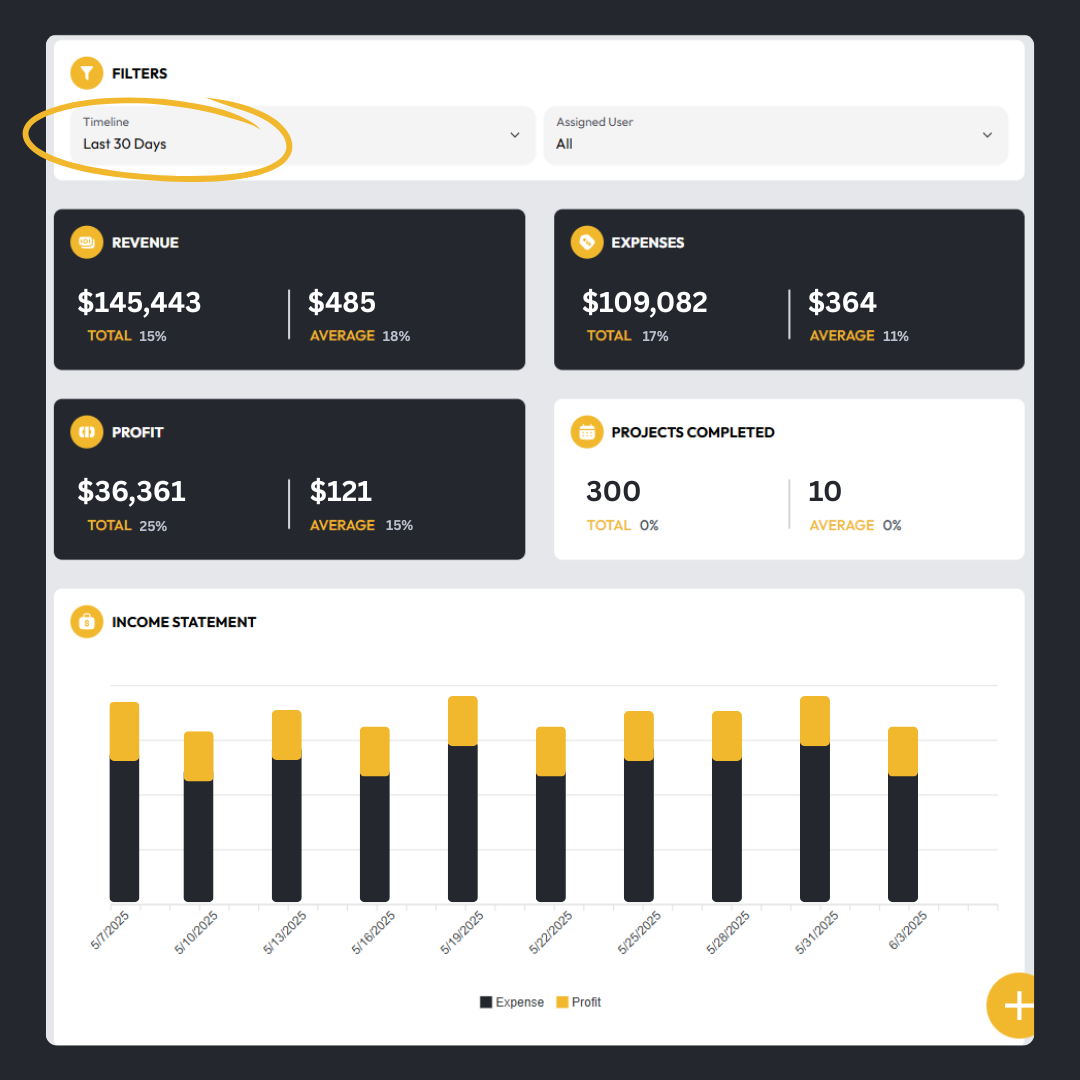
Daily, weekly, monthly or year to date — pick the window and the whole report follows. Check whether last month's price change actually helped, spot the seasonal dip before it lands, or find out which service line quietly carries the business.
No credit card required · cancel anytime
Questions contractors ask
Find out what
you're actually keeping.
Real-time revenue, true profit and job-level margin — from $39 a month.
No credit card required • Cancel anytime